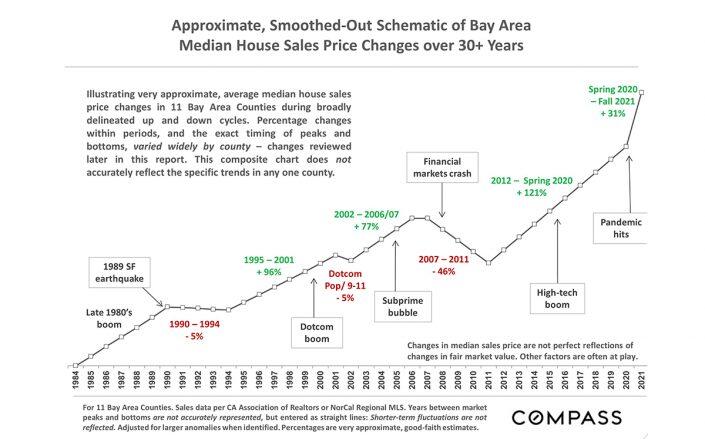
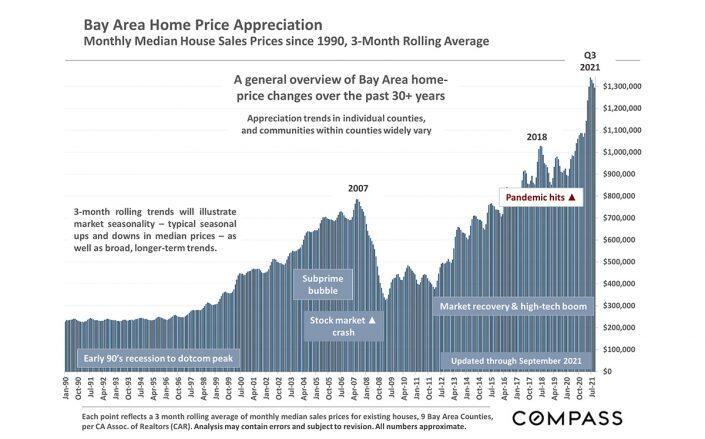
After looking back over 30 years of Bay Area housing data, Compass Chief Market Analyst Patrick Carlisle is confident that the pandemic-driven market is among “the most ferocious” in history.
That’s one of the surprises revealed by a recent Compass study that examined housing prices in eight Bay Area counties since 1990. Among them: median home prices in San Mateo, Santa Clara and San Francisco counties soared more than 500 percent in that period.
“It’s interesting to see how big a role technology booms have played in our ups and downs,” Carlisle said via email. “The three counties at the heart of the dotcom boom and/or more recent boom are at the top for overall appreciation, with staggering 30-year appreciation rates.”

Alameda County jumped 465 percent in that period while the rest of the Bay surged by between 330 and 420 percent. That’s well above a 250 percent increase nationwide shown by the Case-Shiller Home Price Index, which Carlisle said uses a different algorithm than the Compass study and often runs lower than figures based on median home prices.
Carlisle was also taken aback by the disparate impacts on local markets by the subprime crisis, which he described as being “wholly caused by irrational or dishonest human behavior.”
Less wealthy communities were more likely to be hurt by predatory lending, so more affordable Bay Area neighborhoods had the biggest rise and subsequent crash between 2001 and 2010.

Lower-priced homes rose more than 100 percent above dotcom peaks by 2006 to 2007 and then fell to almost 25 percent below 2001 prices after the 2008 financial crisis. The priciest homes rose just 40 percent by the 2006-2007 peak and briefly bottomed out at 2001 levels in 2009 before beginning to appreciate again.
Still, median values in San Francisco neighborhoods dropped by anywhere from 20 to 45 percent between 2005 and 2012, with more affordable neighborhoods hit harder. Contra Costa County had a “colossal” 65 percent crash in that span, according to the report, while more expensive areas such as Moraga and Orinda fell by about 30 percent.
Affluent markets close to tech centers also recovered first after prices began heading back up in 2012. The report points to both the subprime bust and subsequent IPO boom to explain how the median value of six of eight Bay Area counties rose more than 100 percent between 2012 and pre-pandemic 2020.
Marin had the lowest increase in that time, 83 percent, because it wasn’t harmed as much by the subprime crisis and wasn’t “at the heart of the high-tech boom,” according to the report. That changed during the pandemic, when prices jumped 34 percent between the spring of 2020 and this fall as people sought more space for less money and were no longer as tied to their office commutes.
Pandemic prices rose most quickly outside tech-heavy areas. Contra Costa rose 44 percent. Alameda, home to the nation’s “most competitive market”, was up 42 percent and Santa Cruz rose 38 percent.
Even though higher-priced areas may not have gained as much during the pandemic, already expensive price tags meant they also had a big uptick. San Francisco’s 20 percent appreciation, for example, equals about $200,000 in increased median home gains in less than two years.
“Who would have guessed that a pandemic, this wild card out of nowhere, with all its strange effects, would lead to one of the most ferocious markets in history?” Carlisle said. Some portions of the Bay Area are wealthier than ever while others have suffered terrible financial hardship, he said.
Carlisle said he undertook the 30-year retrospective because he wanted to understand the economic, political, social and ecological factors that could impact the market and which trends keep reappearing.
“Why don’t historians just look at the last five years?” he said. “History does tend to repeat itself, but new things or new versions of old things also come up all the time.”
