The pandemic-driven downturn has disrupted Manhattan’s office real estate market, where availability has hit record highs in recent months.
But certain pockets of the borough have shown more resilience than others.
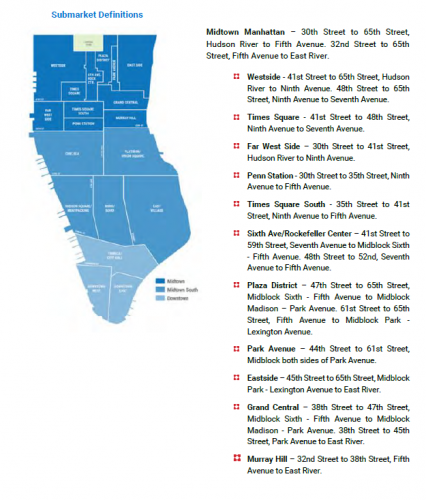
The corridor along Park Avenue between 44th and 61st streets had the strongest demand relative to its availability in the fourth quarter of 2020, according to the relative strength submarket index (RSSI) figures issued by KPG Funds, in partnership with Newmark. The area’s availability was just shy of 4 million square feet, while the demand was 2.4 million square feet. (See the chart below)
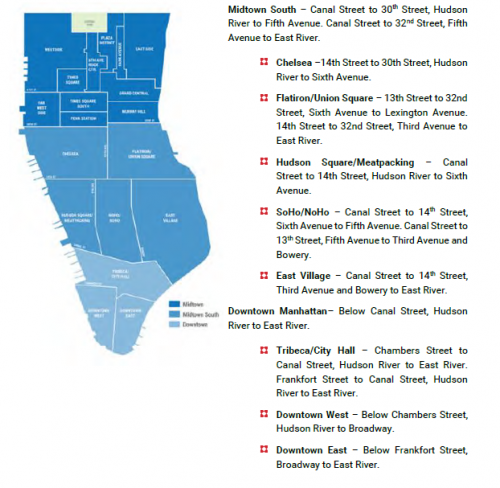
Noho and Soho — which includes the areas between Canal and 14th streets from Fifth to Sixth avenues, and Canal and 13th streets from Third to Fifth avenues — also came in strong in Q4, according to the index. The area had about 1.4 million square feet of availability and 822,000 square feet of tenant demand.
Those areas have remained popular thanks to prospective office tenants who are trying to take advantage of the down market by leasing in neighborhoods where they might have been previously priced out, said Greg Kraut, CEO of KPG.
“Tenants nowadays … want to be around where you could work, live, play,” Kraut said. “As space starts to open up, you’re starting to see even more of a rapid increase into these areas.”
KPG’s index is calculated by dividing total office availability in the submarket by the total square footage in demand from tenants, which is collected from brokers and tenants themselves.
The Far West Side neighborhood, which includes Hudson Yards, was ranked as the third-hottest submarket in the fourth quarter, a major improvement from the second quarter when it was ranked 12th. Total tenant demand increased from 160,000 square feet in the second quarter to 600,000 square feet in the fourth quarter. The upswing was despite the increase in availability from 740,000 square feet to 1.1 million square feet.
Read more


The weakest submarket in Q4 was “Westside,” defined as the area between 41st to 65th streets from Ninth Avenue to the Hudson River, along with the blocks between 48th and 65th streets from Seventh to Ninth avenues. In the three-month period, it had 4.8 million square feet of availability and 360,000 square feet of tenant demand.
The second weakest market was “Eastside,” or the area between 45th and 61st streets from the midblock between Lexington and Park avenues to the East River. The area’s availability was 4.9 million square feet in the fourth quarter, while the demand was 452,000 square feet.
Investors are increasingly referring to more targeted data to help guide their decisions, said James Nelson, principal and head of Tri-State investment sales at Avison Young, adding that his firm offers customized data to its investment market clients.
And a neighborhood-by-neighborhood analysis can help guide landlords when they negotiate leases with prospective tenants, said Eric Meyer, principal of Meyer Equities.
“If there are a lot of tenants in the market relative to the space available, when negotiating rents and terms, you have more of a position of strength,” Meyer said.
But there’s one common goal in the current data analysis: pinpointing where the demand is.
“This is a demand-driven market,” said Craig Leibowitz, executive director for data, analytics & strategy for Avison Young. “The degree to which demand can be quantified and qualified, that’s what informs investment decisions as much as anything else.”


