Lenders slowed down with Chicago-area foreclosure filings in July and August.
Cook County recorded 731 foreclosure lawsuits started by lenders in July and 645 in August, rising from June’s total of 623, but lower than May’s 845. March still holds this year’s high for foreclosure starts at 1,030.
The total mortgaged value behind July and August’s foreclosure efforts totaled $373 million. July had $217 million-worth of mortgages slide into takeaway lawsuits whereas August had $156 million.
The median mortgage value as of each loan’s origination to fall into foreclosure in July was $178,703, and $171,830 in August, both of which were higher than in May ($171,400) and June ($161,025).
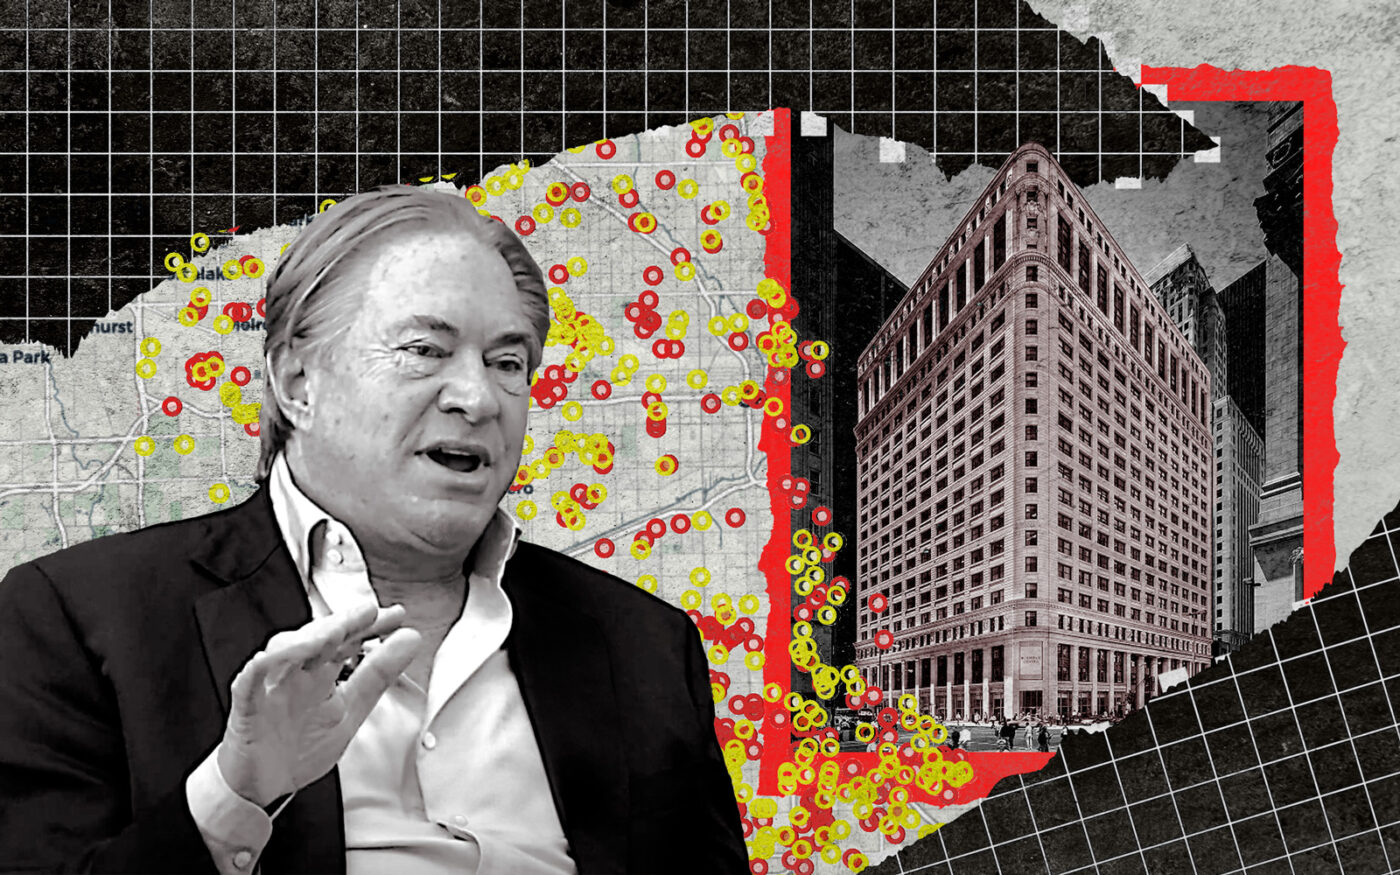
The 584,000-square-foot, 21-story Burnham Center took the title of biggest foreclosure of the last two months at $42 million. Wells Fargo, in its capacity to oversee a trust that served as the property lender, filed a lawsuit against the landowner Shidler Group.
U.S. Bank again filed the most foreclosure complaints in Cook County in July and August, at 92 and 94, respectively.
Here’s where Cook County foreclosure court cases began in July and August:
Nationwide, foreclosure filings slowed in August, according to Irvine, California-based real estate data firm ATTOM. August foreclosures declined 5.3 percent from July, and 11 percent from the same time last year.
Chicago, along with Miami and Orlando, Florida, and Riverside, California have the highest foreclosure rates in the nation. In Chicago, one in every 2,450 housing units faces foreclosure, according to the report.
In Cook County, the last two months also had less total value tied to mortgages that started going through the foreclosure process. May and June’s foreclosure efforts totaled $252 million and $161 million, respectively. For March and April, foreclosure efforts totaled $237 million and $211 million, excluding the biggest mortgage for a Loop office property — GEM Realty and Farallon Capital’s 70 West Madison Street — that was hit with a $305 million foreclosure lawsuit in April.
Read more


